all = 1*c13a + 0.2*c13p + 0.8*c12a + 0.05*c12p + 2.5*dp + 0.2*o16p + 1.5*o16a + 0.1*b11p + 0.1*b11a
where "c13a" is the alphas produced from reactions on 13C, and similarly for the other waves. Here's the results for the 19' strip.
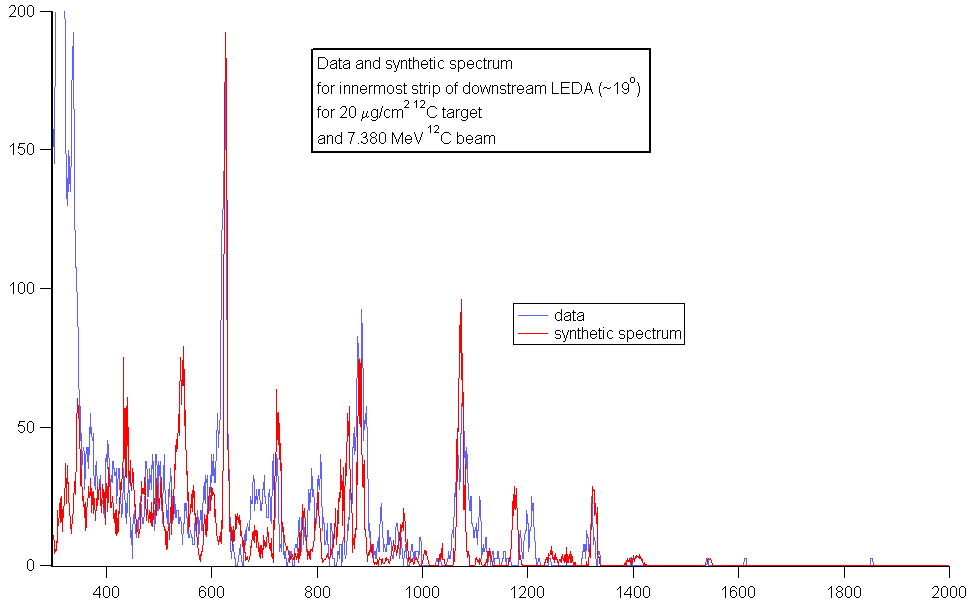
The other thing to note is that the data energies have been shifted in this strip by
+12 channels * 10 keV/channel = +120 keV
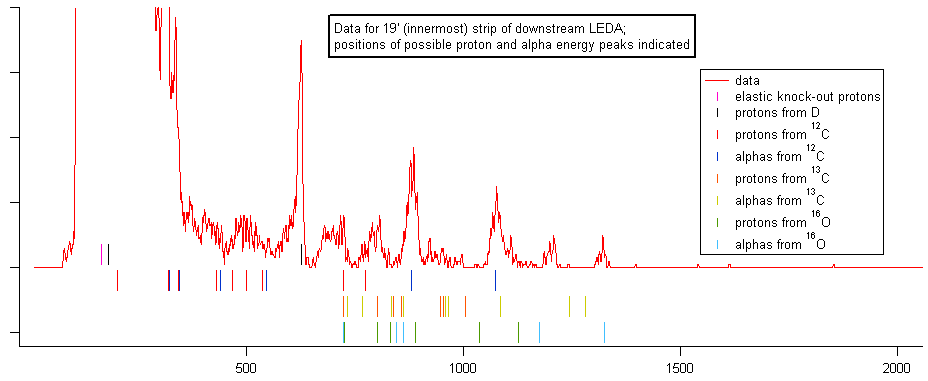
Some of the synthetic peaks are good matches; others aren't. The thing is that these synthetic spectra populate all possible levels equally (taking no account of Jpi values or angular distributions). It would be interesting to make a plot that indicates only the locations of the peaks from various reactions, so that we could pick and choose which peaks from a given reaction are being populated.
...okay, here's what that would look like:
No comments:
Post a Comment