I don't have techno-fear--I have techno JOY!!! --Eddie Izzard.

Wednesday, January 24, 2007

E1106 calibration reaction

The reaction of interest is 17O (beam energy 3.45 MeV) + p (gas pressure 10 Torr) --> α + 14N, via a resonance in 18F of 183 keV lab resonance energy and width Γ=0.3 eV. The candidate calibration reaction is 18O+p-->15N + α via a 151 keV resonance in 19F with width Γ=0.3 keV.

kinematic curves for both reactions (the legend is wrong because I am a numpty: the residuals are obviously N isotopes not O isotopes)


cross sections for both reactions, as a function of position in the gas cell


Cross section as a function of position, for coincidence events


Residual (14N or 15N) hitting S2 detector: for coincidence events


alphas hitting barrel detector: for the same coincidence events

Friday, January 19, 2007

Darren's Louvain experiment revisited

Here's an annotated copy of the detector configuration paper from Darren's thesis. Dimensions of the detectors and their positions are indicated.

Friday, January 12, 2007

Orsay data: theta calibration?

In this post, I simulated the elastic scattering events that are coincidences between dets 1 and 4. Here are the results for some data.
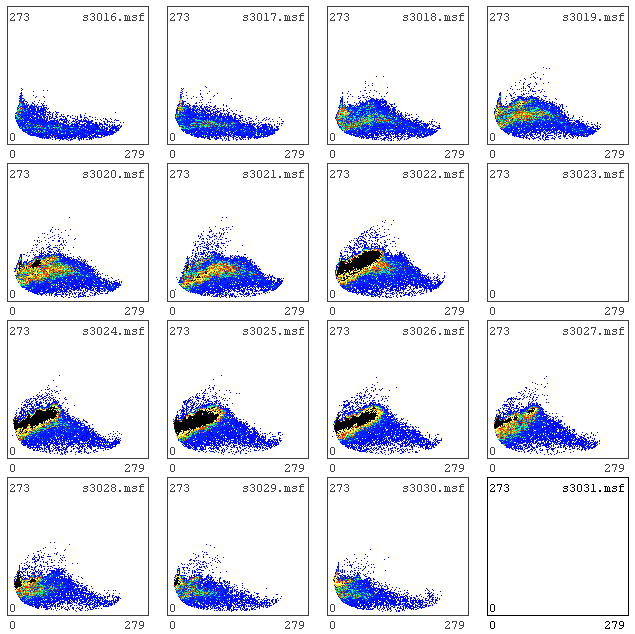
sort routine: require exactly one good det 1 event and one good quad event. (A good event in det 1 means that both ends of one strip fire. A good event in det 4 means that both ends of one strip fire, and the corresponding strip in det 3 does not fire.) Also require that strip number 6 in det 1 is always the one to fire. (Having a single strip in det 1 simplifies the energy gain matching: the gain-match parameters have not been selected at all so it would be surprising if the energies of all strips of det 1 were even similar.) The hits in det 1 look like this (all strips, E vs p):


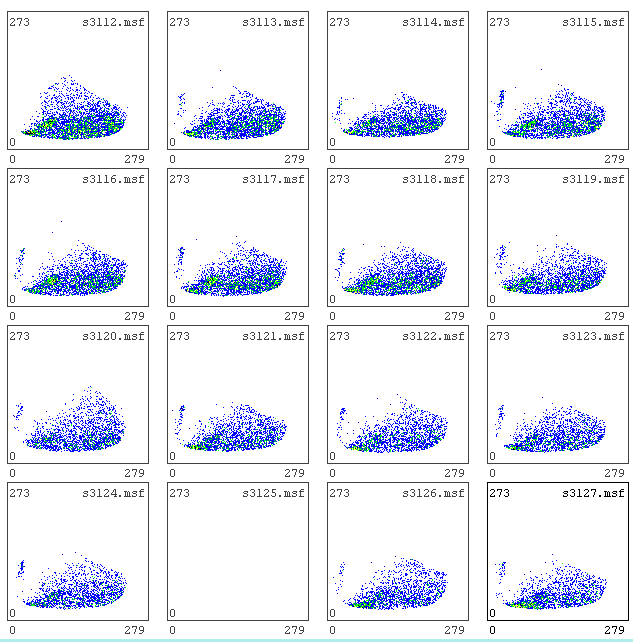
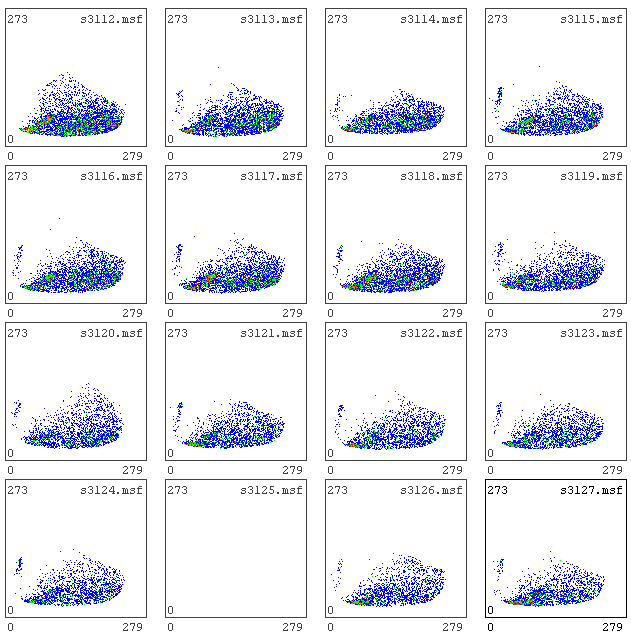
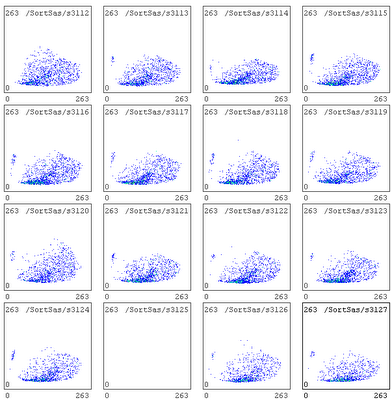
and the hits in det 4 look like this (all strips, E vs p):


Distribution of theta hits in det 1 strip 6: theta conversion used is theta = 15-9*position


Distribution of theta hits in det 4 all strips: theta conversion used is theta = 63-14*position


Theta for det 4 all strips vs theta for det 1 strip 6:


I was hoping that, as I messed around like this with the data, some patterns would appear and/or start making sense. But I still don't know...
  • why the det 1 E vs p loci seems to slope up to the right. Does that mean that right (= large position) = small theta, or just that the gainmatching is bad?
  • why the det 1 E vs p loci don't extend all the way across the detectors. Does this mean that left (= small position) = small theta = high intensity, or just that there's some kind of threshold/triggering problem?
  • what all the blobs in det 4 correspond to...it looks like there are several distinct things happening, but I have no idea what any of them are.
I'm going to select one region in strip 6 of det 4 and see what patterns emerge in its data. Here's the region:


and here are the corresponding events in strip 6 of det 1: Now we're onto something!


Here are the blobs from det 4 strip 6 (on the right; the one used for gating) and det 1 strip 6 (on the left; the resultant).


For completeness, try gating on the other three evident blobs in det 4 strip 6:


For comparison/orientation, here's the ungated data for det 1 (top) and det 4 (bottom):

Thursday, January 11, 2007

Orsay data: selecting different strips in detector 4

require a good event in strip 3 of detector 4: here are the coincident events in det 1:

same for strip 7 of det 4:

same for strip 11 of det 4:

same for strip 15 of det 4:


As the strip number in det 4 increases, more events come in lower strip numbers in det 1. (This is eyeballing it, because I can't remember how to take the area of a 2d spectrum in Midas.)

Orsay: relative energy distribution for alpha coincidences

Alex's suggestion: calculate relative energy for (simulated) two-alpha events, see if there's a spectrum.
Results: see figure: there's a clear peak, with a fwhm of about 250 keV.


To duplicate this in the data, need some kind of position-to-theta mapping. If the position is linear in theta, then the mapping should be as follows:
detectors 2 and 3: θ = 96 - 14 p or 96 - 14(1-p)
detectors 4 and 5: θ = 63 - 14 p or 63 - 14(1-p)
where p goes from -1 to 1, and the two options account for the two possible orientations of the strips (low p = low theta or the opposite).

Wednesday, January 10, 2007

18F(p,α): update

Don Tomas el Sabio wrote:
The detector energy resolution for alpha particles and oxygen ions
is ~10keV and ~80keV FWHM respectively plus (in quadrature) the dead
layer energy straggling.

If we consider 1H(18F,4He) at E_lab=6.5MeV (say) the beam energy
loss in a 50ug (CH2)n target is ~0.8MeV or E_CM = 0.300 - 0.345MeV.
Can you allow the beam to interact at random depths within the 50ug
and 100ug (CH2)n targets at the energy appropriate to that depth
(E_beam - dE) and, including the various effects on resolution, plot
the beam's actual interaction energy versus the sum of the 15O+alpha
energies (for given angles)?

Here's an update. This simulation is done using energy straggling parameters derived from SRIM, so more accurate (though at least for the alphas not much different) than what I had before. The interaction position is randomly chosen within the target (flat probability distribution). The beam loss/straggling is calculated up to that point. From then on, only straggling of the outgoing particles is taken into account--that is, I assume we can somehow correct for the average energy loss. There is also angular straggling included, which for the 15O is fairly large. The detector is an S2 at 100 or 500 mm downstream. The beam energy at the time of the reaction is reconstructed using the measured particle energy and angle (θ).
The simulations were done for two CH2 target thicknesses (50 and 100 μg/cm/2) with beam energies chosen to get 6.27 MeV in the centre of the target (6.7 and 7.1 MeV respectively).
Here's a plot of how the standard deviation of the reconstructed beam energy changes with different degrading factors (click for a larger version):

What this implies is that the (corrected, particle-dependent) energy resolution of the detector is by far the dominant factor in the resolution of the final measurement, if you're using a 50 μg/cm2 target. The beam straggling through the thicker target can have an additional degrading effect, but everything else gets washed out.

Revised Update: try plotting the actual beam interaction energy as a function of the sum of Eα + E15O, for a narrow range of alpha angles (choose 19-20'). (I tried making a similar plot for 5-7' and it was virtually identical.)


Same thing, 16-18', thick target:

Thursday, December 14, 2006

Orsay data: still looking for coincidences

The data: Run 105 (80 MeV 14C on nat C)
The sort routine: require exactly one good event (i.e. both ends of strip have good signal) in det 1 (downstream), and exactly one good event (i.e. both ends of strip have good signal, and the complementary strip in det 3 does NOT have a signal) in det 4 (downstream quad).

Strip number of hit in det 1


Strip number of hit in det 4


det 4 strip number vs det 1 strip number


I find that last plot quite encouraging: it looks just like this one (the simulation of the same thing), just with strip numbers reversed for det 1.
I don't think that necessarily means that most of what we're seeing is elastic scattering (although it strongly suggests that that's true), but it makes it highly improbable that it's noise at any rate.

Orsay data: looking for coincidences

The data: Run 105 (80 MeV 14C on nat C)
The sort routine: require exactly one good event (i.e. both ends of strip have good signal) in det 1 (downstream), and exactly one good event (i.e. both ends of strip have good signal, and the complementary strip in det 3 does NOT have a signal) in det 4 (downstream quad).

Trying to track which events in one detector match events in another detector.

First gate on a single strip in det 1 and see where corresponding events go in det 4. Here's the strip in det 1...


...and here are the corresponding events in det 4.


Now gate only on a selected bit of that strip in det 1: try to select the most intense part of the locus that I think looks like elastic scattering. Here it is...


...and here are the corresponding events in det 4. The fact that they are show up more in one side of the detector than the other is encouraging. There also do seem to be loci, although I'm not yet sure what to make of them.

Wednesday, December 13, 2006

Orsay: Simulations of coincidences

Reaction:
  • Of alpha-alpha coincidences, where both particles are detected with good energies in both ends of the strips, 99% involve both particles hitting a single detector
  • 4% of those events involve both alphas hitting the same strip
  • the "upstream" detectors, 2 and 3, each have just over 40% of the two-alpha events, with the remainder being in the downstream detectors.
  • Assuming that we can reconstruct the initial energies of the alphas from the energy they deposit, in some sort of sensible way, it should be possible to calculate a Q-value for the reaction from the two alpha energies and angles, with a fwhm of ~5oo keV

Elastic scattering:
  • Strip vs strip, E vs E, and theta vs theta for the reaction products from 80 MeV 14C on 12C:


Distribution of theta hits for elastic scattering coincidences between dets 1 and 4:

--> we expect real ES events to occur mostly between 15-20' in det 1 and 69-75' in det 4; also 18' in det 1 corresponds to ~69' in det 4.

Alphas (just to check geometry)

Monday, December 11, 2006

18F(p,α): factors limiting resolution

The idea:
18F(p,a)15O
18F beam, energy set to populate 330 keV resonance in 19Ne,
2mm beamspot
CH2 target, 50 and 100 ug/cm2
detecting alpha and 15O forward in silicon, say S2s

What is the resolution with which we can reconstruct the centre of mass energy for the two target thicknesses and what is the dominant factor affecting the resolution?
The simulations:
  • The beam energy should be near 7.116 MeV (lab) to populate the compound-nucleus state of interest.
  • The residual (15O) is in its ground state. (It would be straightforward to consider other excited states; just say the word!)
  • All reactions were done assuming an actual energy where the reaction takes place of 7.116 MeV. There is probably actually a spread of energies around the resonance that will result in the state being populated, but I'm neglecting that for now.
  • Use measured energy and theta for both outgoing particles (α and 15O) to calculate the energy the beam must have had (in the lab) at the time of the reaction: calculate the standard deviation.
  • Each simulation was done using only one limiting factor. The graph below shows the results.
What the graph shows:
  • standard deviation of Tbeam for all events (blue bars) and for coincidence events (i.e. both particles hit a forward S2 detector: unless the detector position is noted as 500 mm, it is 100 mm downstream of the target) (red bars).
  • "perfect": no limiting factors: the beam energy is calculated using the actual initial values of energy and theta for both outgoing particles: there is no energy loss in the target or the dead layer, and the detector does not introduce any error in energy or theta.
  • "ples in 50 ug tgt": the particles' energy straggling (not loss--we're assuming we can reconstruct the energy loss perfectly) in a 50 μg/cm2 target is taken into account. The reaction position is randomly chosen to be anywhere in the target. This is an overestimate: the reaction may actually take place in a narrow range of positions near the centre of the target. Update: I did a simulation of the beam's energy loss to see over what range of positions the reactions were likely to take place: turns out it's like a gaussian with a fwhm of 2 ug/cm2 at the centre of the target for 50 ug/cm2 target. Putting that position distribution into the particle energy loss simulation doesn't change the results that much, actually: 1 keV for both "all" and "coincidence" cases, for 50 ug.
  • "ples in 100 ug tgt": same as above, only assuming a 100 μg/cm2 target. Like with the thinner target, the position range over which the reaction takes place isn't very important: the results using a realistic distribution (near the centre; gaussian with fwhm=5 ug/cm2) are 3-4 keV different from the results using a flat distribution over the whole target.
  • "deadlayer": the particles' energy straggling in the deadlayer is calculated.
  • "Erez": the detector is assumed to have an energy resolution of 50 keV for both particles: the measured energy of a particle is then its true energy plus a random number that has a Gaussian probability distribution with a fwhm of 50 keV.
  • "det granularity 500 mm": Theta is calculated using the particle's hit position on the detector (if it starts on axis at the target) given the downstream detector distance of 500 mm, and a strip width of 0.5 mm: theta is the effective theta of the strip the particle hits.
  • "det granularity 100 mm": same as above, only for a detector distance of 100 mm downstream.
  • "beamspot 500 mm sigma=2mm": the detector is 500 mm downstream; the beamspot has a Gaussian probability distribution with a sigma of 2 mm; the effective theta of the particle is calculated from its hit position on the detector given that it starts off axis at the target.
  • "beamspot 100 mm sigma=2mm": same as above, but the detector is closer.
  • "beamspot 100 mm fwhm=2mm": same as above, but the Gaussian distribution has a fwhm (not sigma) of 2 mm.


(Click for a larger image)

What these results seem to show is that the dominant source of error is the detector itself: the loss in the detector dead layer, and its energy resolution. The resolution won't get dramatically worse using the thick target. I do tend to distrust the simulation results for energy losses of low-energy heavy particles in the dead layer though. I could do a Srimulation to check those numbers.

It's important to note that the alphas at backwards angles will have such low energies that they will stop either in the target itself or in the dead layer: above 90', all the alphas have an initial energy of less than 1 MeV. So it will be impossible to detect coincidences for the highest-cross-section ejectiles: we'll be restricted to detecting the lowest-cross-section part of the solution where both particles are going forward.

Thursday, December 07, 2006

Orsay: attempting to gainmatch det 1


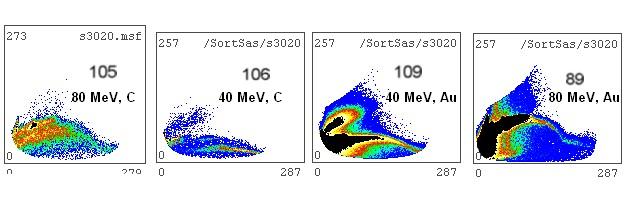
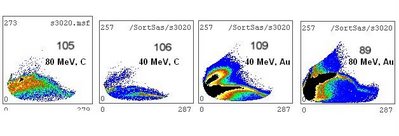
The above image compares data for the same strip of detector 1 for four different data sets: 80 MeV 14C beam on carbon target; 40 MeV beam on carbon; 40 MeV beam on gold; 80 MeV beam on gold. There are some features that clearly scale by approximately a factor of 2 as the beam energy increases, but it's not clear what those features are! Also there is a feature that seems to be in approximately the same location in all runs. I was initially trying to identify it as one of the expected elastic scattering loci, but now I'm wondering whether it isn't just an artefact of the ... amplifiers? pre-amps? since det 1 wasn't using the splitter boards, we can't blame those.
(The other thing that's obvious is the odd shapes of the loci: things that should be straight lines are either graceful curves or squiggles. No theories on that yet.)
Test: select two groups in det 1 and see where the corresponding events are in the quad. --> need to use run 105 for this test, because the 40 MeV C runs may have v. low energy coincidences in the quad, and the gold runs will have no coincidences at all.
Hypothesis: The upper group (the one that looks about the same in all runs) will correspond to noise or bad events in the quad, and the lower group will correspond to good coincidences.
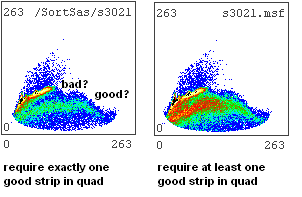
...is there a way to eliminate bad quad events entirely? Could do a quick comparison: the current results (with the requirement that "good strips in det 1" greater than 0 and "good strips in quad" greater than 0), vs. the same data sorted requiring exactly one good strip in det 1 and exactly 1 in the quad. That way would miss some good events that also had noise, but *should* eliminate the bad events. Let's see. ...actually the opposite seems to happen: run 105 sorting with quad greater than 0 has more coincidences than sorting with quad = 1.
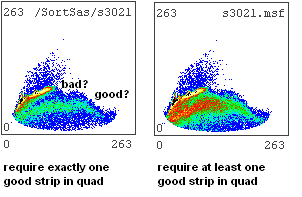

The figure compares the same data (strip 5 of det 1) with two different conditions: at least one hit in the quad vs exactly one hit in the quad. The colour scale is the same for both trials. The locus labelled "good" is what I think might be the real elastic scattering events. weird.

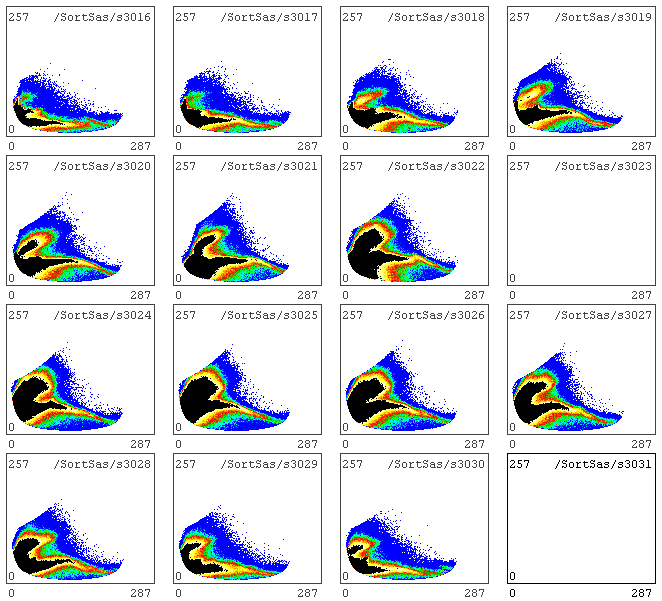
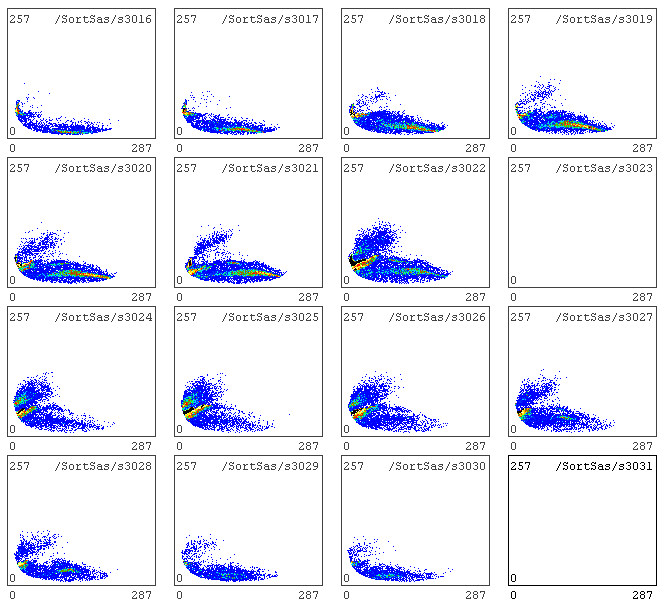
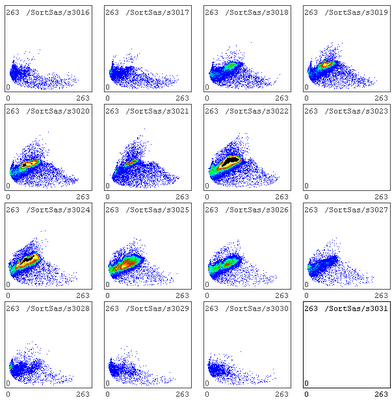
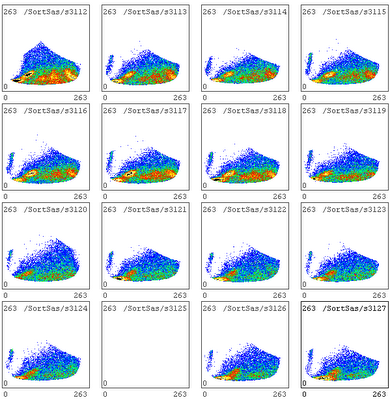
Try a different way of making the coincidence requirement: require exactly one good event in det 1 (both ends of strip fire), and exactly one very-good event in det 4, since it will get half of the real coincidences and most of the identifiable ones (both ends of strip fire and the complementary channel in det 3 doesn't fire).
The results are astonishing.
det 1 80 MeV carbon (run 105)
det 4 80 MeV carbon (run 105)
det 1 40 MeV carbon (run 106)
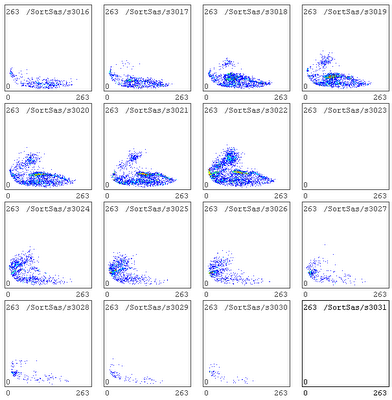
det 4 40 MeV carbon (run 106)

--What I was tentatively identifying as the "good" events have no real coincidences, while the "bad" events mostly do have coincidences. weird.

So now. Trying again to calibrate det 1.....

Friday, December 01, 2006

Orsay: real data

40 MeV 14C on gold: require at least one good event (both ends of the strip fire) in det 1; ignore quad. Energy vs position (along strip) spectra for all strips in det 1:


80 MeV 14C on gold: at least one good event in det 1. Energy vs position for det 1:


40 MeV 14C on nat C: at least one good event in det 1, plus at least one good event in the quad. Energy vs position for det 1:


...and energy vs position for det 4 (the best of the quad):


80 MeV 14C on nat C: at least one good event in det 1, plus at least one good event in the quad. Energy vs position for det 1:


...and energy vs position for det 4:


80 MeV 14C on nat C: at least one good event in det 1, plus at least TWO good events in the quad. Energy vs position for det 1:


...and energy vs position for det 4: