I don't have techno-fear--I have techno JOY!!! --Eddie Izzard.

Thursday, October 05, 2006

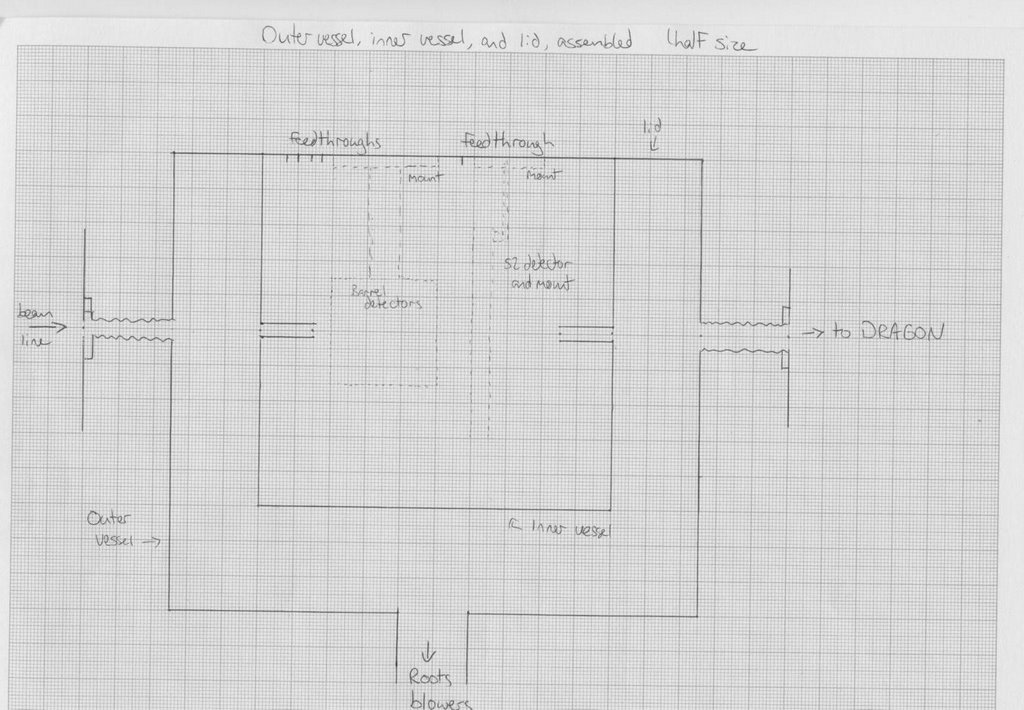
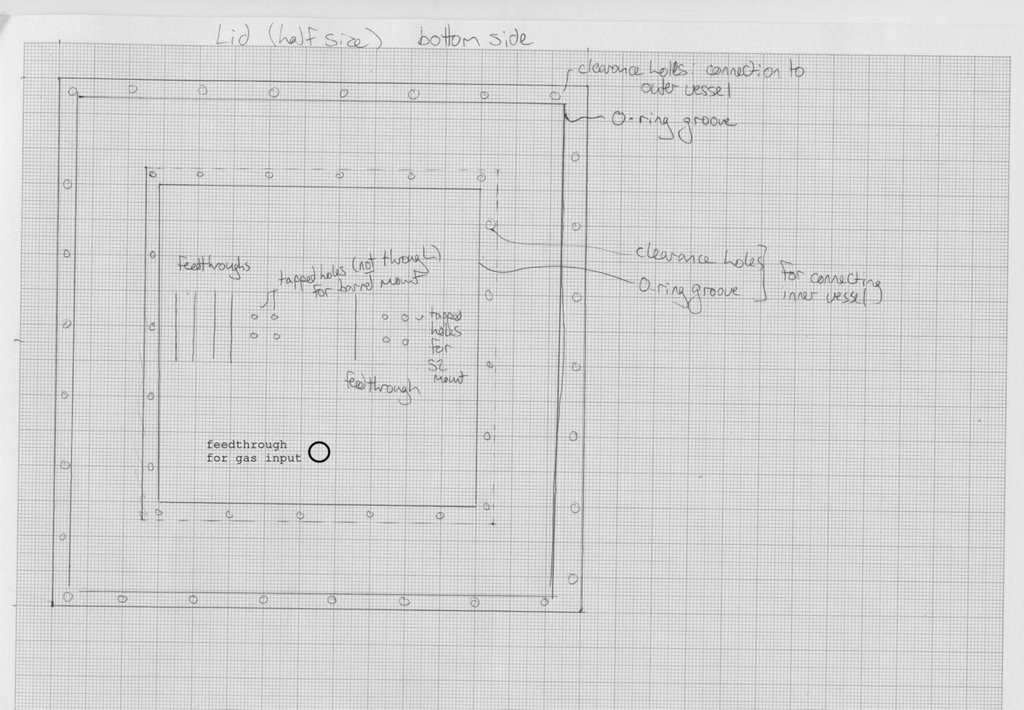
sketches for TuDragon

The drawings are on 1 cm grid paper, and are either to scale or to half scale.
The drawing of the lid indicates two o-ring grooves in the lid; those should go in the top surfaces of the inner and outer gas cells themselves.


Thursday, September 28, 2006

Unsimulated Orsay data again

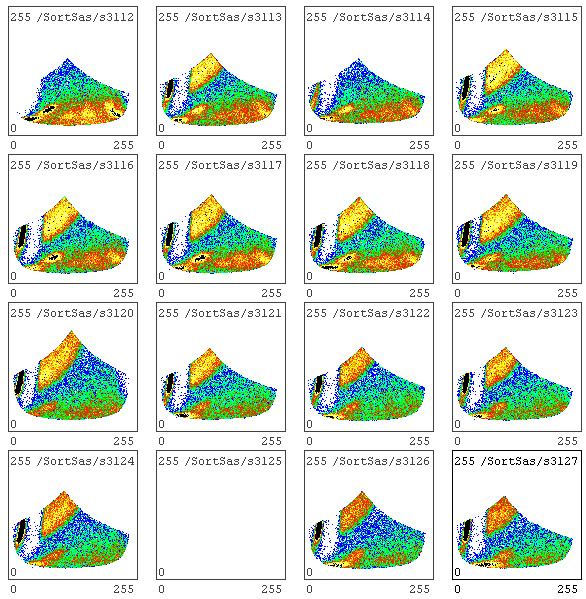
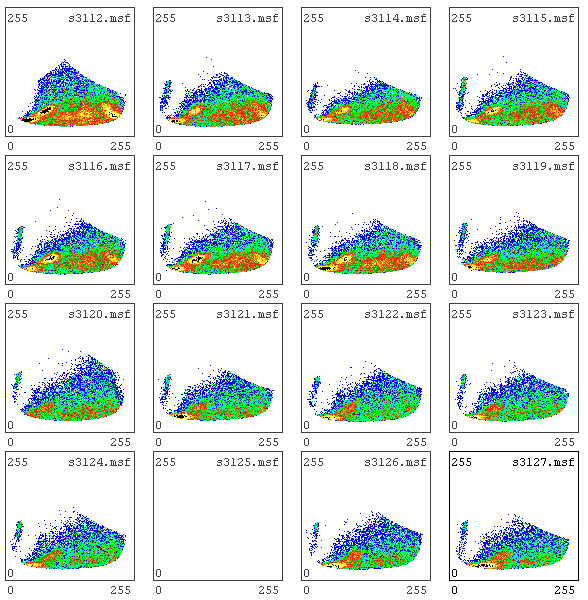
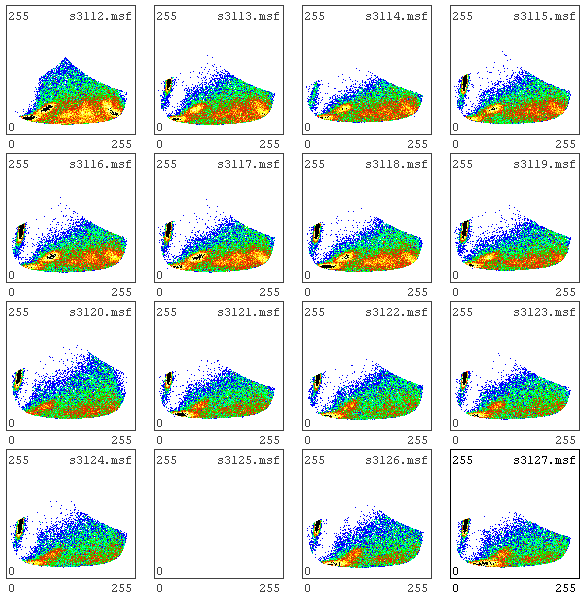
All images here use data from run 105 (80 MeV 14C on 50 μg/cm2 natC)

Singles data from all detectors
detector 1 (forward)


detector 2 (backward in quad)


detector 3 (backward in quad)


detector 4 (forward in quad)


detector 5 (forward in quad, possibly not biassed, and with dodgy gain-matching)


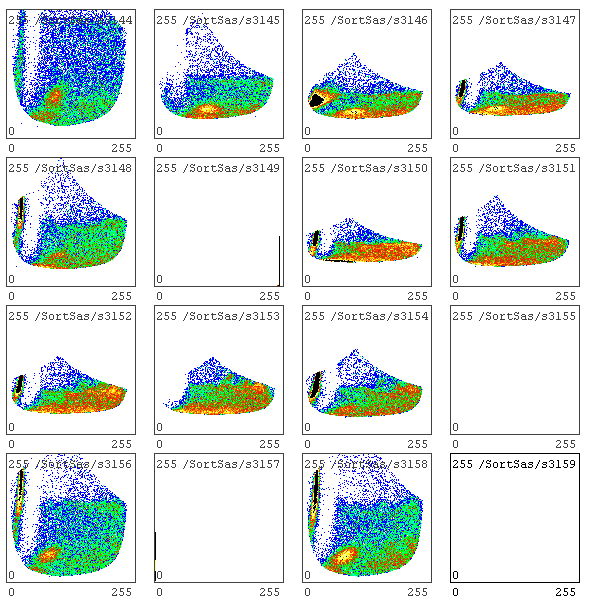
detector 1, requiring exactly 1 good quad event (and incidentally at least one good det 1 event)


detector 4, requiring exactly 1 det 1 good event and 1 quad good event.


detector 4, requiring exactly 1 quad event (and however many det 1 events; automatically eliminates complementary-detector events)


detector 4, requiring exactly one good event in det 1 (and as many quad events as you like)


detector 1, requiring exactly one good event in det 1


detector 4, requiring one good event in det 1 and at least 1 good event in the quad


detector 4, requiring one good event in det 1 and at least 1 good event in the quad: veto events with signals in the complementary strip


detector 4, requiring at least 1 good event in the quad: veto events with signals in the complementary strip

Monday, September 04, 2006

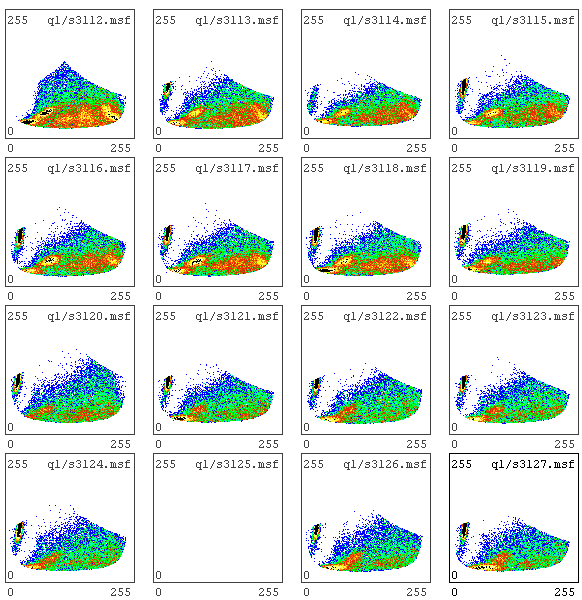
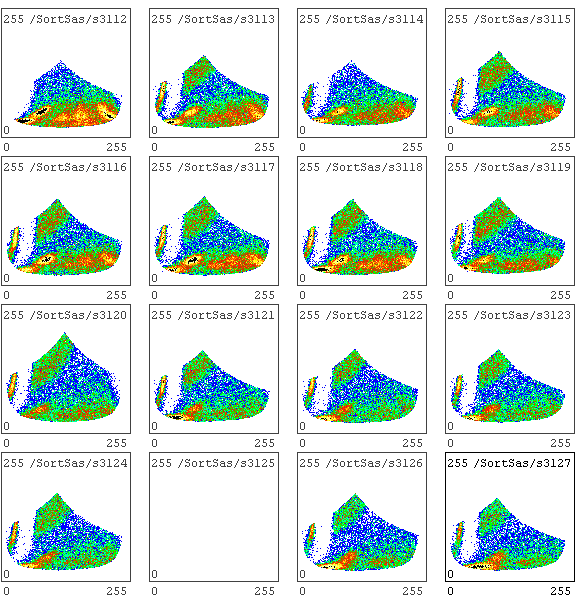
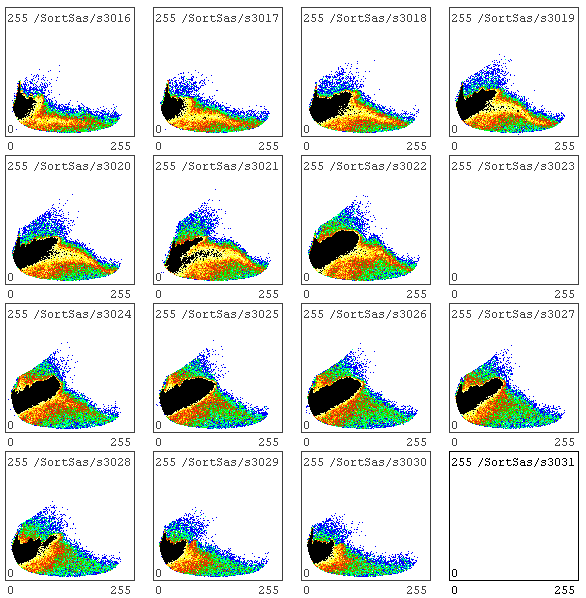
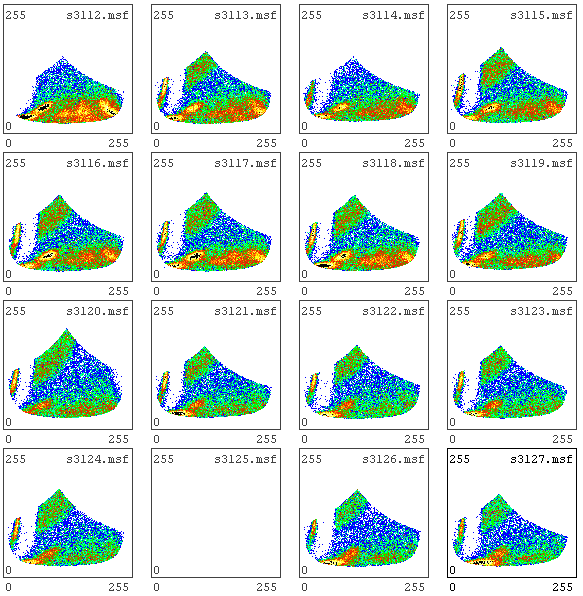
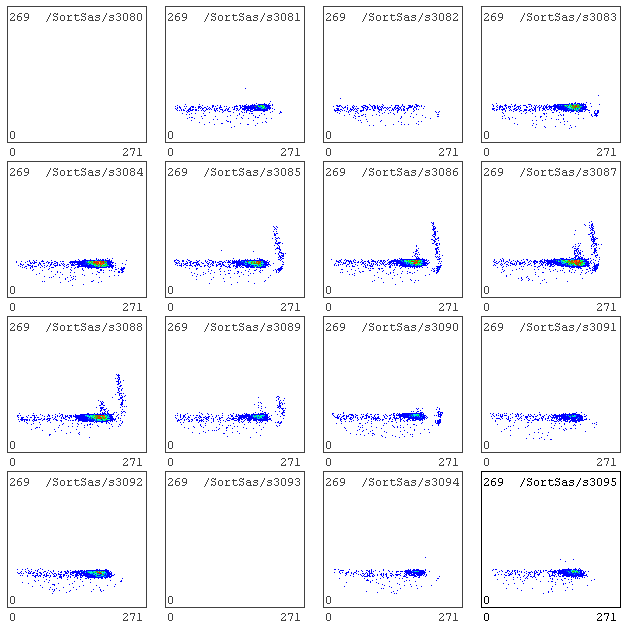
unsimulated Orsay data

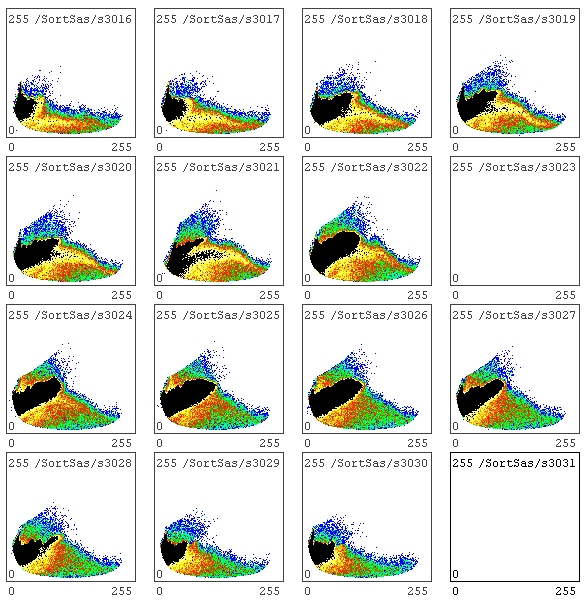
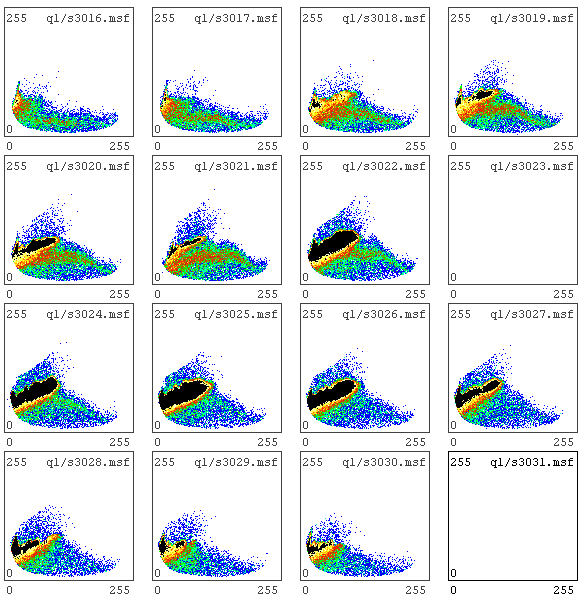
All strips of Detector 3:


All strips of Detector 4:


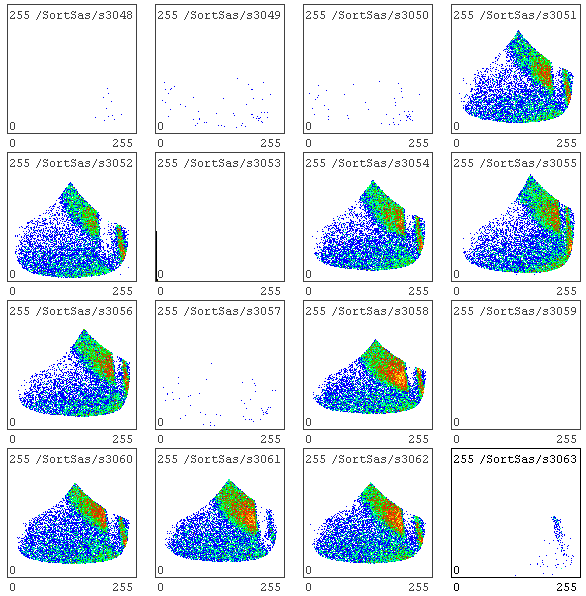
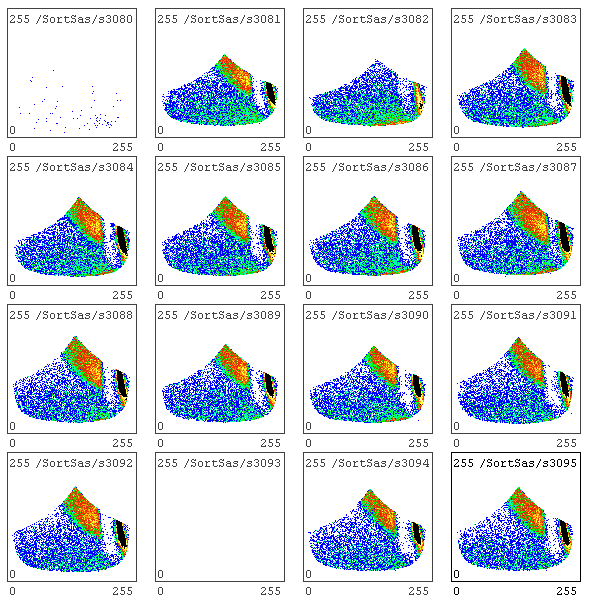
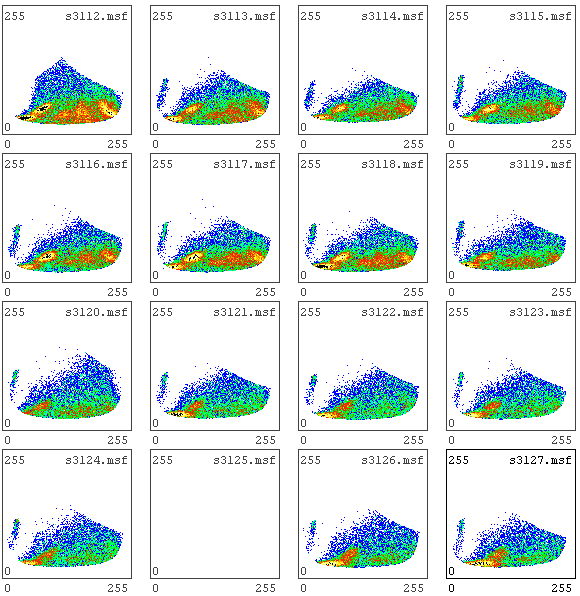
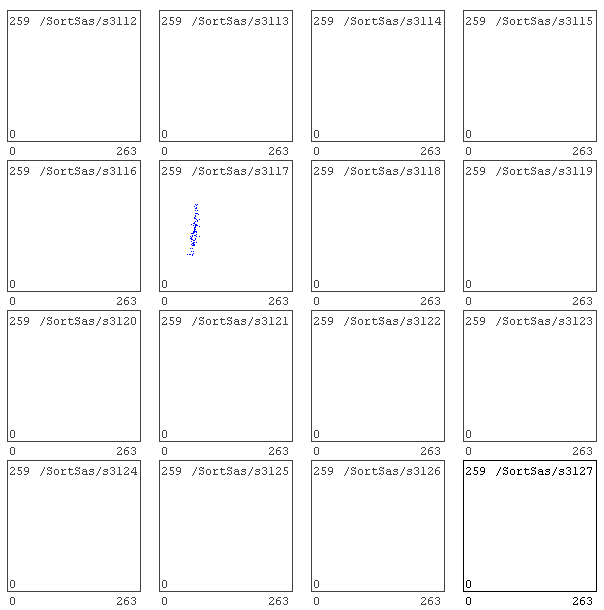
Gate on weird stripe in strip 6 of det 3; show det 3:


Same: show det 4:


(all other detectors had no data in any of the strips)

Those patterns suggest that the weird stripes are noise in the ADCs, rather than inter-strip events like I'd thought.

Unsimulated joy(?)

Some highlights from the logbook from the Orsay experiment:
  • The target ladder is an absolute crap!
  • We *were* here last night, right?
  • 6:30 am: Mind gone soggy
  • 11:30 am: Paul is howling
  • Until 2:45 am, we were triggering on noise. C'est vachement emmerdant.
  • Is the target broken?? Lovely. just lovely.

Thursday, August 24, 2006

17O (p,α) odds and ends

1. 10 Torr results for reaction...
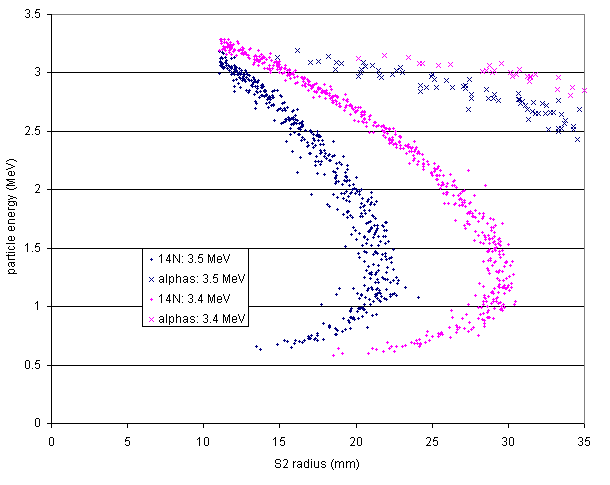
14N hits on S2, with some corresponding alpha hits... (I said proton before--I meant alpha!)


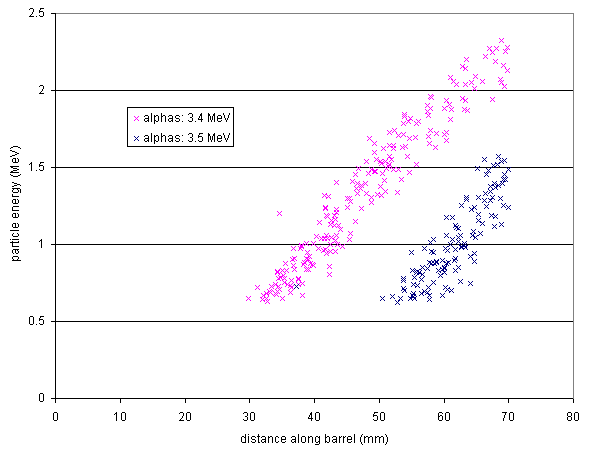
...and the remaining corresponding alphas on the "barrel" detectors...


2. 10 Torr: elastic proton rate:
I made a...let's call it a careless oversimplification with the angular distribution for the previous proton rate calculation; but I don't think it had much of an effect. On the other hand, the incorrect number of atoms in the target that I used DID have an effect--the rates I calculated were at least an order of magnitude too high. I did a very detailed new calculation of energy losses for the protons.

The input:
H2 gas: pressure=10 Torr, total cell length=10 cm
beam: 3.3 MeV 17O
detectors: S2 and barrel detectors in the now-standard positions
scattering cross-section: calculated by Tom
atoms in target: 7e16 atoms/cm2
beam current: 1e11 pps
protons to damage detector: 1e11 per cm2

The results:
520 000 protons/s in barrel; 970 000 protons/s in S2
--> 5200 protons/cm2/s in barrel; 28 000 protons/cm2/s in S2
--> 1.9e7 s to damage barrel; 3.6e6 s to damage S2
-->445 (12 h) shifts to damage barrel; 83 shifts to damage S2.

If (if) these new calculations are correct, we don't need to worry about limiting beam current to keep from frying the detectors. Also, the rate in a single strip of the S2 would be ~20 000 protons/s (but they could be eliminated by setting a threshold), and there would be a 13% chance of having a proton come in at the same time as a 14N. Not too bad!

3. Calibration reaction:
Chafa and Fox both use the 18O + p --> ElabR=151 keV 19F resonance for calibration. As near as I can tell, that level in 19F has a width Γ>0.3 keV (quite different from the 0.3 eV width of the state of interest in 18F). That means that the width of the state (instead of the beam energy loss in the gas) becomes the dominant factor in the resonance length in the cell.
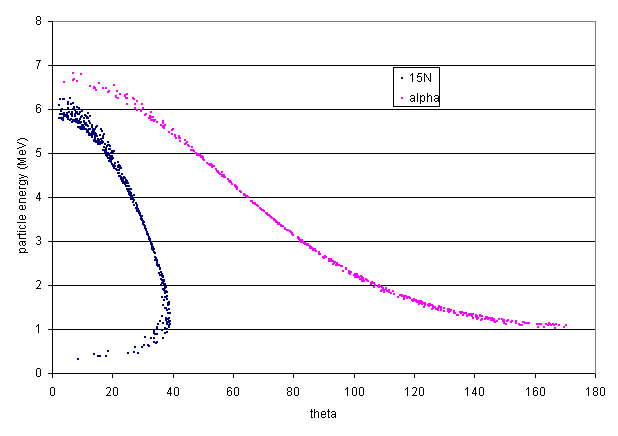
Here's the kinematic curves for the reaction...


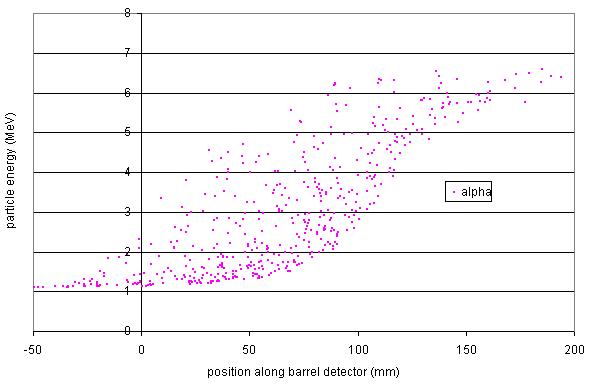
But because the reaction can happen at any point in the cell (instead of at a nicely constrained point like in the 17O+p reaction), the measured energy-versus-detector-position curves are smears...note that the x-axis on both of these plots bears no resemblance to the actual extents of the detectors....


At the least this means that the efficiency for detecting this "calibration" resonance will be quite low and hard to determine. Also, particle identification will be hard in the absence of clear loci for the particles of interest--how will we tell them apart from contaminant reactions?

Comments?

Wednesday, August 23, 2006

26Alm experiment at Yale

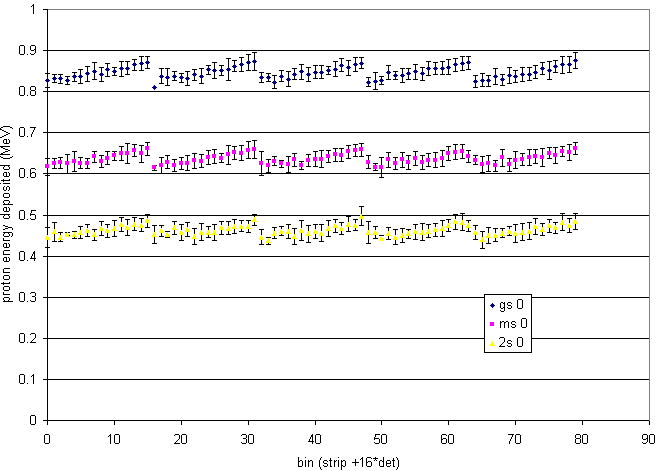
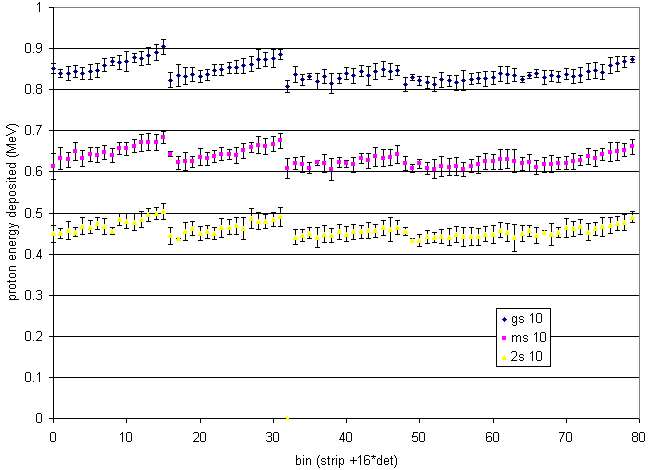
Since all of the proton decays that we see are L=0, there's nothing to prevent us from putting the spectrometer at non-zero angles. The disadvantage is that each strip must be treated separately instead of adding strips of the same theta from different detectors together, and this in itself might be enough to require that the spectrometer be at zero degrees...but here's what happens if it isn't:

Ingredients:
30 MeV p beam.
Energy loss and straggling of proton beam and proton decay through a 100 μg/cm2 metallic 28Si target.
Tag on d to isolate decays from an 8.5 MeV level in 27Si to the ground, metastable, and second excited states of 26Al.
YLSA in the standard position (assuming all five sectors working!).
Energy loss and straggling of protons through dead layer of YLSA; also assume that YLSA has a resolution of 15 keV for protons.

Results:
Energy (average; error bars represent standard deviation) of protons in each individual strip of YLSA for a spectrometer angle of 0'... (click on a picture for a bigger version)


...and 10'


I was afraid that somehow the spectrometer angle would lead to a blurring of the individual decays' lines, making them harder to resolve; but as long as the strips are treated separately, there should be no problem with resolution.

Comments?

Monday, August 14, 2006

17O(p,α) detector configuration

Ingredients
  • beam energy spread of 0.4% (Marco's best estimate)
  • gas cell pressure of 4.5 Torr (could increase this)
  • 120 mm between beginning of high-pressure region and S2
  • "barrel" detectors of lengths, widths, and positions to be determined...
  • beam diameter of 3 mm (fwhm) (estimate from Dave H.)
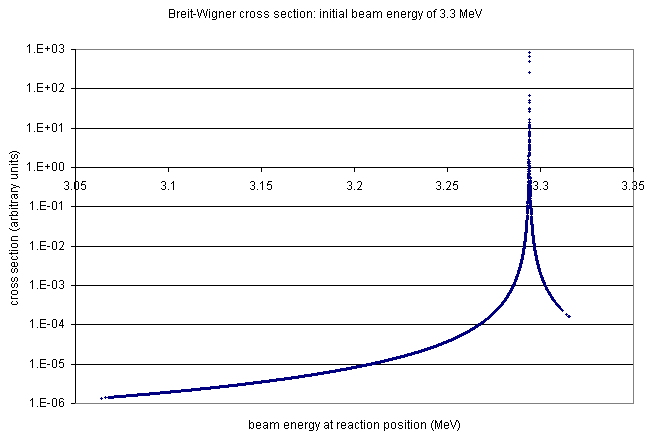
  • Breit-Wigner cross section for reaction through 183 keV (cm) resonance with width of 0.3 eV: energy dependence goes as
    1/[(E-ER)2 + (Γ/2)2]
    where Γ is the total width of the excited state in 18F.


The figure above shows the (renormalized) Breit-Wigner cross-section calculated for each event. (For all figures, click for a larger version.)
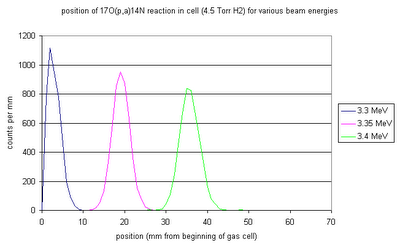

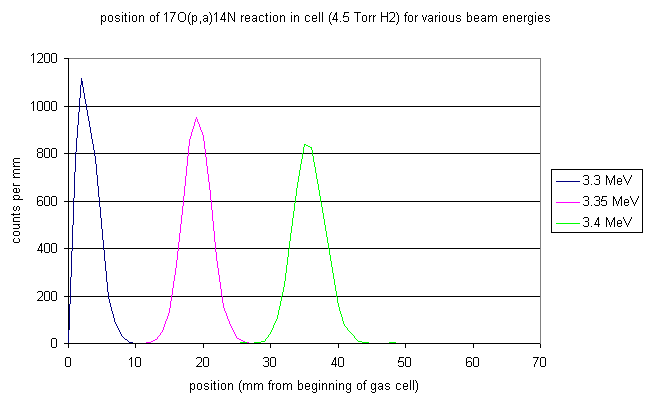
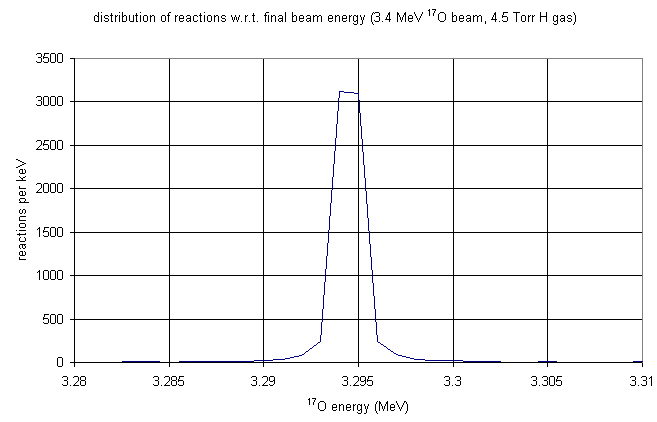
Combining the beam resolution, energy loss/straggling in gas, and the width of the resonance gives the above distributions of reaction positions for various initial beam energies. Higher initial energies move the resonance position downstream in the cell, and as the straggling of the beam through the gas cell becomes more severe the resonance length in the cell increases.

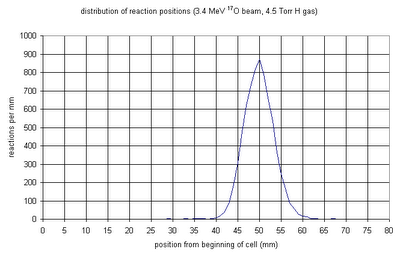
Here are two more figures showing distributions of resonances: the first with respect to position in the cell, and the second with respect to beam energy at that position.

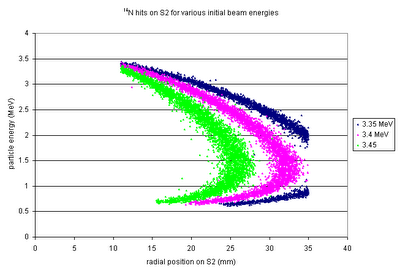


The 14N from different possible beam energies will have different energy-position curves on the S2.
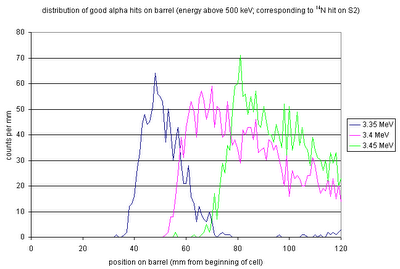


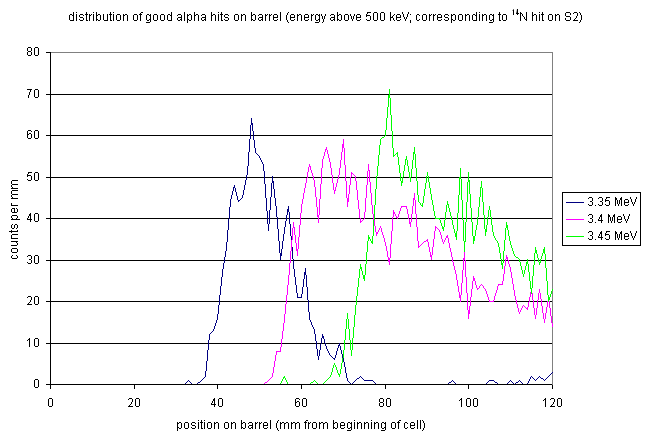
The corresponding alphas (with energies high enough to be detected!) will have the above position distributions on the barrel detectors.

Try the following configuration: four 5 cm x 5 cm double-sided silicon strip detectors, each at a radial distance of 35 mm from the beam line, with the downstream edge of the active area 10 mm upstream from the S2--so they cover 60-110 mm downstream from the beginning of the cell. Then the efficiency (for detecting both 14N and alpha with energies above 500 keV) is 53% for E(beam)=3.45 MeV and 37% for E(beam)=3.4 MeV. If we want only 14N, the efficiencies for those beam energies are 85% and 88% respectively.
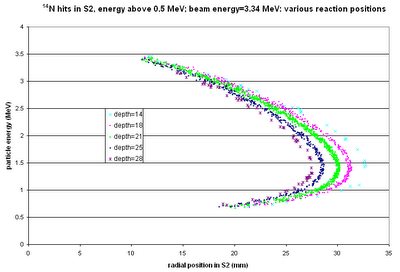


The above shows the kinematic curves for 14N from reactions at various positions in the cell ("depth=18" --> the reaction position is 18 mm downstream from the start of the gas cell). For the largest-angle events, we could get quite good position resolution, but for smaller angles all the positions blur together.

Rate estimates:
Jonty estimates that the Dragon 17O(p,γ) experiment will have a rate of 2 counts per hour. Factoring out the 45% BGO efficiency and the 50% charge state efficiency, that's a total of 10 total events per hour. The (p,α) /(p,γ) yield ratio is (so far) reported as 750, so we'd get 7407 total events per hour with Jonty's assumed beam current of 1011 particles per second. With our efficiency, that's 6480 14N singles or 3700 coincidences per hour. At the same beam current, we'd also get a LOT of protons, especially into the S2: about 400 kHz per strip. At that rate (and current) it would take 50 hours to fry the S2 (where "fry"=1x10¹¹ protons per cm2--is that right, or can they take more?) (NB: this is taking into account the differential cross section for elastic scattering of the protons, and also their energy loss through the gas and dead layer--most of them do in fact stop before they get to the detector.) Since the protons in the S2 are of lower energy than any of the particles of interest, the thresholds on the data acquisition can be set to eliminate them from the data stream; but there's still the risk of pile-up. At 400 kHz, the time between protons (in an individual strip of the S2) is ~2 μs; the same order as the time to read out a good event--so there's a high probability of getting at least one proton at the same time as a good particle, changing the energy measured. Reducing the current to 1010 particles per second would increase the average time between protons to ~20 μs--more manageable--and would also increase S2's lifetime to 500 hours (42 shifts--also manageable).
UPDATE: Tom points out that the width of the analogue pulse from the shaping amp (taken to be the width at 0.1% of the maximum amplitude) is ~ 6-7 μs, for a 0.5 μs shaping time; and that the busy time for the DAQ while reading an event is ~ 30 μs.
Using Poisson statistics, the probability of NOT having a proton hit a strip while it is forming the pulse for a good 14N event is: 6% for 1011 pps; 76% for 1010 pps; 97% for 109 pps.

In the time it takes to fry the S2 (at whatever current), we could expect to see 325 000 singles and 185 000 coincidences. (That's our total count, from all strips of all detectors; the per-strip counts are lower: for example ~6800 14N/strip in the S2.

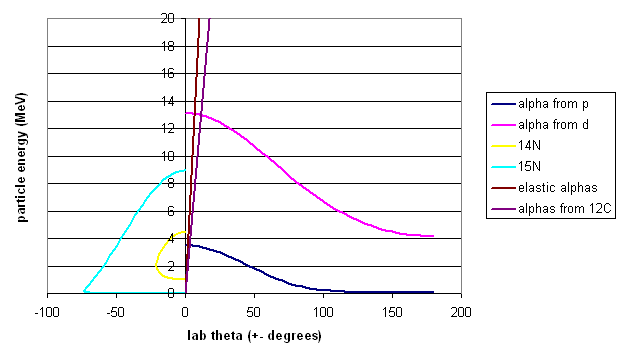
Also: a note about contaminants: Very simple kinematic calculations (no energy loss included) give the following...
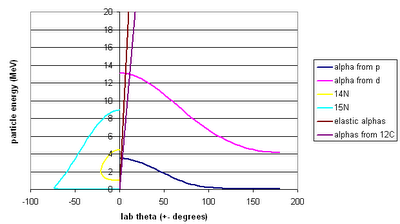
The reactions are on the protons that are supposed to be in the gas cell ("alpha from p", "14N") and on the deuterons ("alpha from d", "15N"), helium ("elastic alphas"), and 12C ("alphas from 12C") that might be contaminants in the gas cell. I don't think there's anything to worry about here: the energies are all very different from the energies of the particles we're interested in.

Details about proton rate calculation:
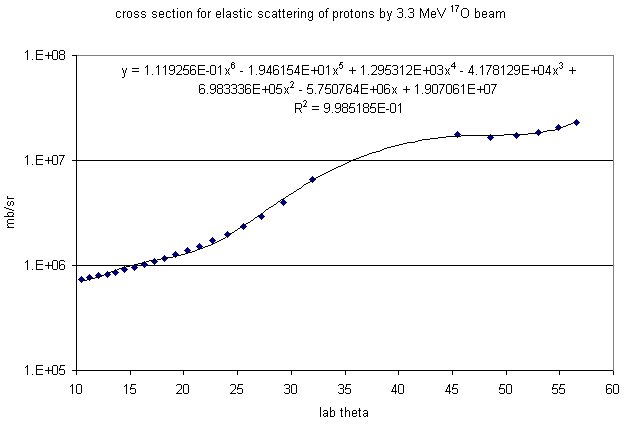
  1. Do polynomial fit to elastic scattering cross section calculation:
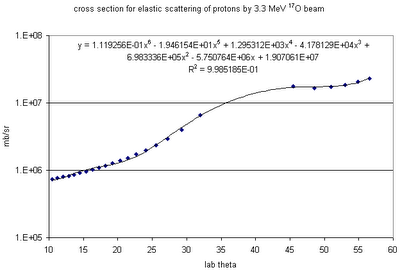


  2. Do SRIMulation of energy loss of protons of various initial energies and angles, through the gas and the detector's dead layer; derive fit to fraction of protons that reach detector with energy >1 keV (as function of angle).
  3. Combine those two fits to give a total probability function: probability of proton of angle θ (and consequently energy E0) reaching the detector. Apply that probability function to randomly-generated angle in Monte Carlo code.
  4. Test the angle to see whether the proton's initial angle and position result in a detector hit.
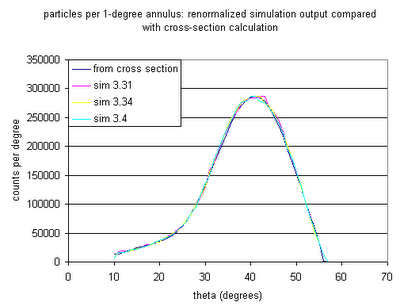
  5. Count the total number of detector hits. Renormalize as follows....Use the probability function from step 3; the solid angle for annuli of 1 degree width centred on 10, 11...60 degrees in theta; the atoms/cm2 in the target (2.55e18 for 4.5 torr); the particles per second in the beam; and calculate the total number of particles per second scattered into each 1-degree annulus. Then obtain the same number for the simulation (particles into each annulus for an N-event simulation) and find the renormalization factor that converts (particles per annulus for an N-event simulation) into (particles per annulus per second for a given beam current). Multiply the total number of detector hits by that renormalization factor to get the number of protons per detector per second for the given beam current. The figure below compares the simulation results to the cross section calculation.


Update:
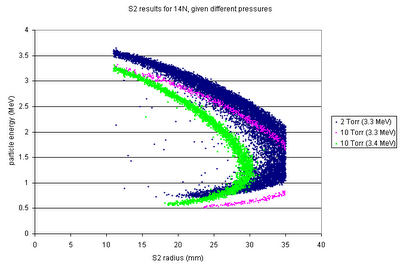
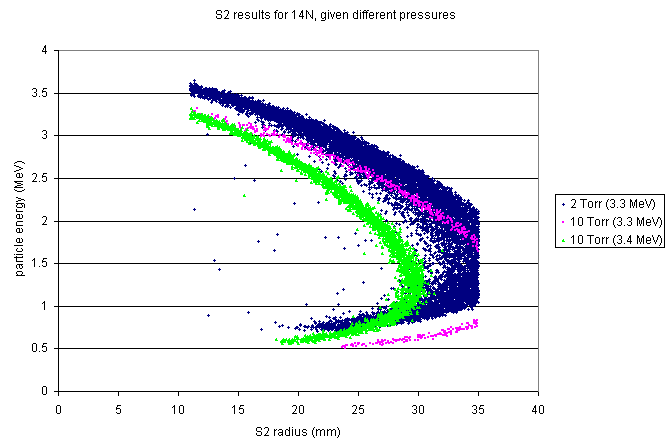
Alison suggested checking out the effect of different gas pressures. It's fascinating. There are two competing effects that change the length in the cell over which the resonance takes place, as the gas pressure increases: the increased beam energy straggle, and the more abrupt change in beam energy (over length). As it turns out, the straggling is less important, and increasing the gas pressure to 10 Torr could help increase our efficiency or at least make it easier to identify loci:
Monday, June 19, 2006

Orsay: efficiency for our actual detector configuration; also online diagnostics
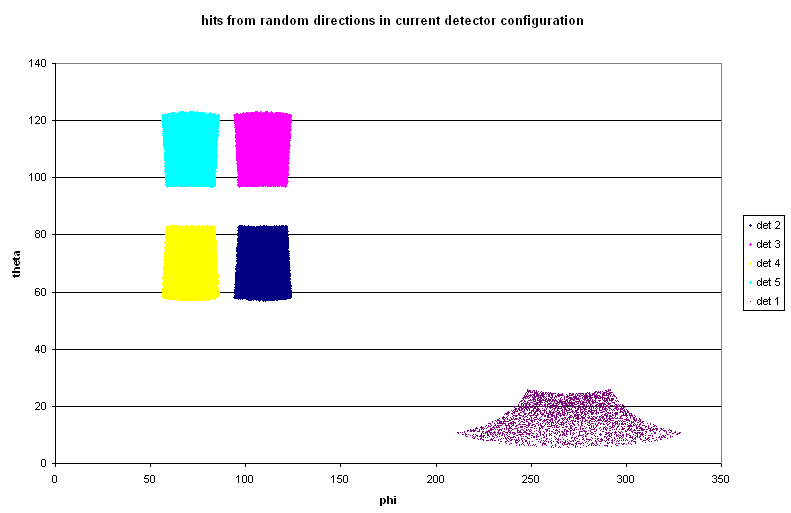
First step: check that my geometry routine is giving sensible results. Give it the detector locations as input, and see how many randomly-generated directions result in a hit. In this way we can also deduce that the detectors cover 7% of the total solid angle.
Detector locations:
"rd={110,110,110,110,150}
thetad={70,110,70,110,15}
phid={109,109,71,71,270}"


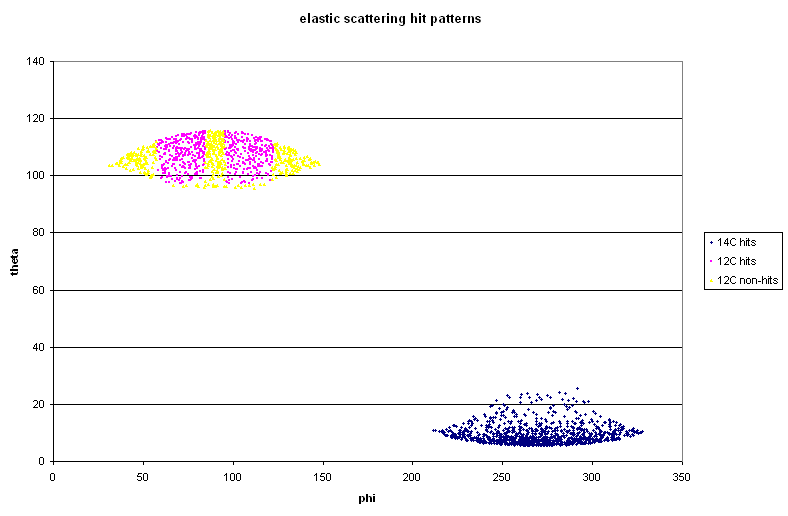
Next step: use the same code (forget about energy loss in the target for now) to see where elastic scattering events hit--both 14C and 12C ejected from target. Just like we see online, most of the 14C hits are at forward angles in detector 1, and the corresponding 12C are in detectors 2 and 4 only.
The thing to note here is that the cross section function used here is purely rutherford--the angular distribution has no "wibbles" in it, to use an Alex-ism.


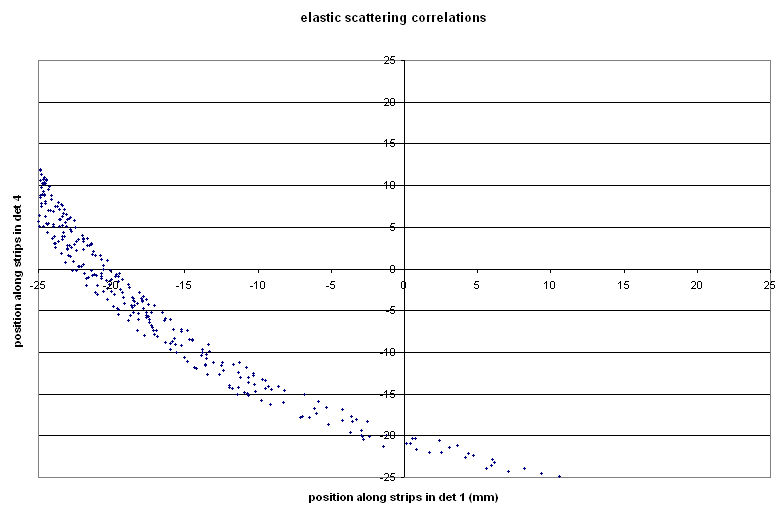
Now try also reproducing the plots of position in det 1 vs position in det 4: Here we get a smooth curve, whereas online there are two clumps. Either the "wibbles" are making their presence felt, or we're seeing reactions or something in addition to elastic scattering.


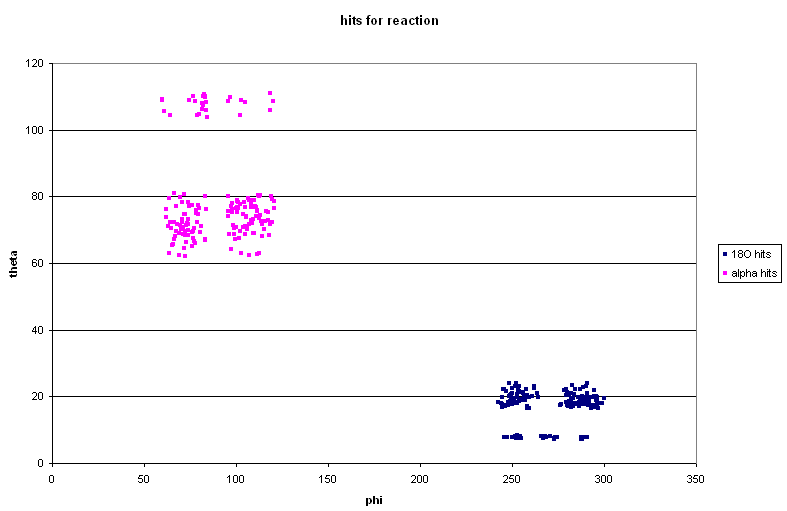
Now for reaction: 80 MeV 14C on 50 μg/cm2 12C: take into account beam spot size, energy loss/straggling in target and dead layer of detector. Hit pattern:


The gaps between the "quad" detectors mean that there are gaps in the "good" 18O hit pattern in detector 1.

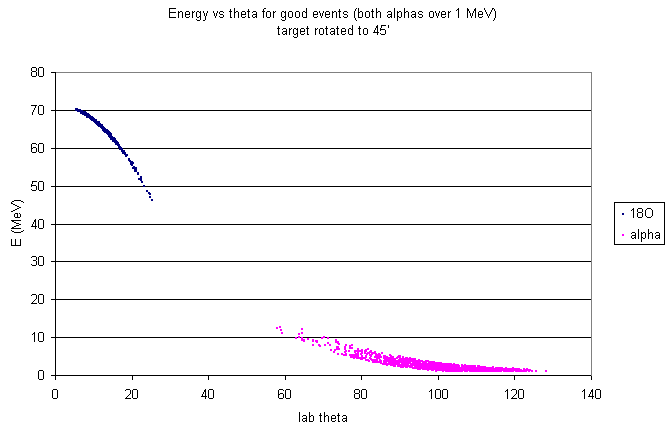
Here's the energy vs. theta plot, too:


Note that both of these "reaction" plots are for good events only, i.e. for events for which the 18O and both alphas are detected and have energies such that the signals at both ends of the strip are above 500 keV. The good events are a small fraction of the total events: 156 total good detector hits for 93180 simulated decays.
10260 O hits; 9825 O hits above threshold
173 alpha hits above threshold
-->0.2% efficiency for good events, although 10.5% efficiency for 18O.

Update: If we move two detectors to 90', we'd get 0.8% efficiency! All we'd have to do is move one mount to 90' on the circular mount, and remove the unused detectors. It would certainly be worth doing this if we're going to run with only two detectors.

Here's the theta and phi ranges of the current quad configuration, together with real 18O hits and potential matching alphas. You can see that most of the potential alphas fall in the gaps between detectors.

Thursday, June 15, 2006

Orsay: and now, the bad news

Not to be a total downer or anything...

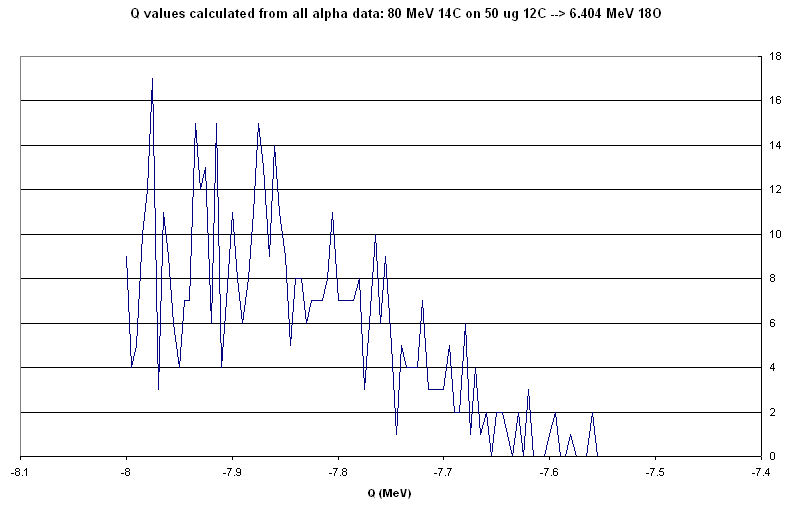
I've been struggling with my beloved simulations over the past couple of days. I'm not bright enough to figure out exactly why they keep crashing. Crashes notwithstanding, this is my best guess at the distribution of Q values we might expect to get from the resonance we want to populate.

What it includes:
beam spot size, granularity of angles calculated from detector position, all energy losses/straggling and angular straggling in target, energy loss/straggling in detector dead layer, cross section for reaction (correct this time!) with the resulting angular distribution of particles.

What it doesn't include:
any spread in beam energy, whether all particles hit the detectors (I sorta faked the detector effects by assuming all particles go through a dead layer straight-on and have their angular information degraded by a given amount)--so it doesn't give any information about our total efficiency. (this is the part that frustrates me--right now I can't figure out why I can't get the geometric part of the code to work right: it should say whether or not all of the particles hit the detectors and whether the energy signals on both ends are over threshold--but so far it's just crashing. grr.)

With those caveats, this is what the Q value distribution should look like.


Ew. This isn't what we were counting on when we were planning the experiment.

Monday, June 12, 2006

Sunday, June 11, 2006

Orsay: emergency cross section calculations!


same as above--this time exclude alphas at forward angles: this means that all 18O fall within 5-11'. alphas are really close to the threshold.


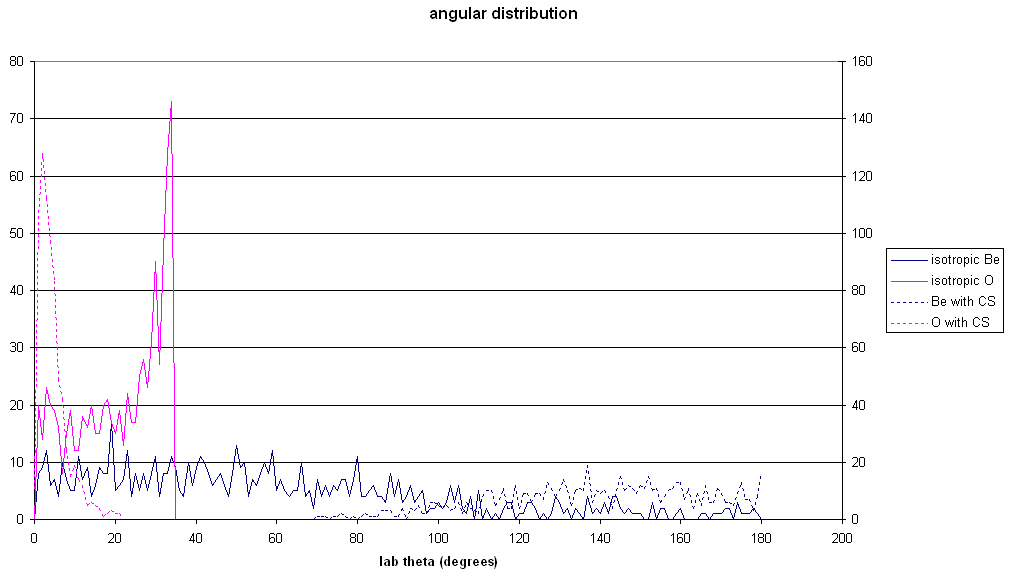
angular distribution for isotropic 18O & 8Be, then with the cross section function applied to 18O's cm angle.


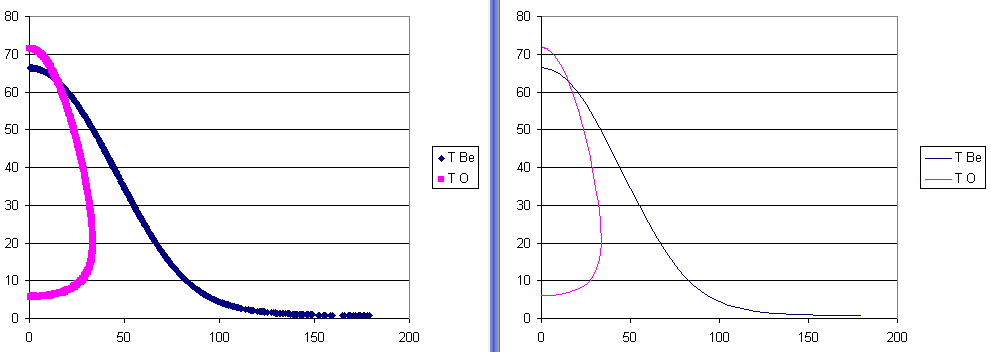
...comparing kinematic results from simulation and jrelkin calculation


...and an energy-angle plot for 18O and 8Be, with the cross section applied: to be compared to the plot directly above: all the low-angle 8Be events go away.